17.2 Decision Making with an Internal Risk Model (IRM)
Focus on Element 5 below, 1-4 discussed else where
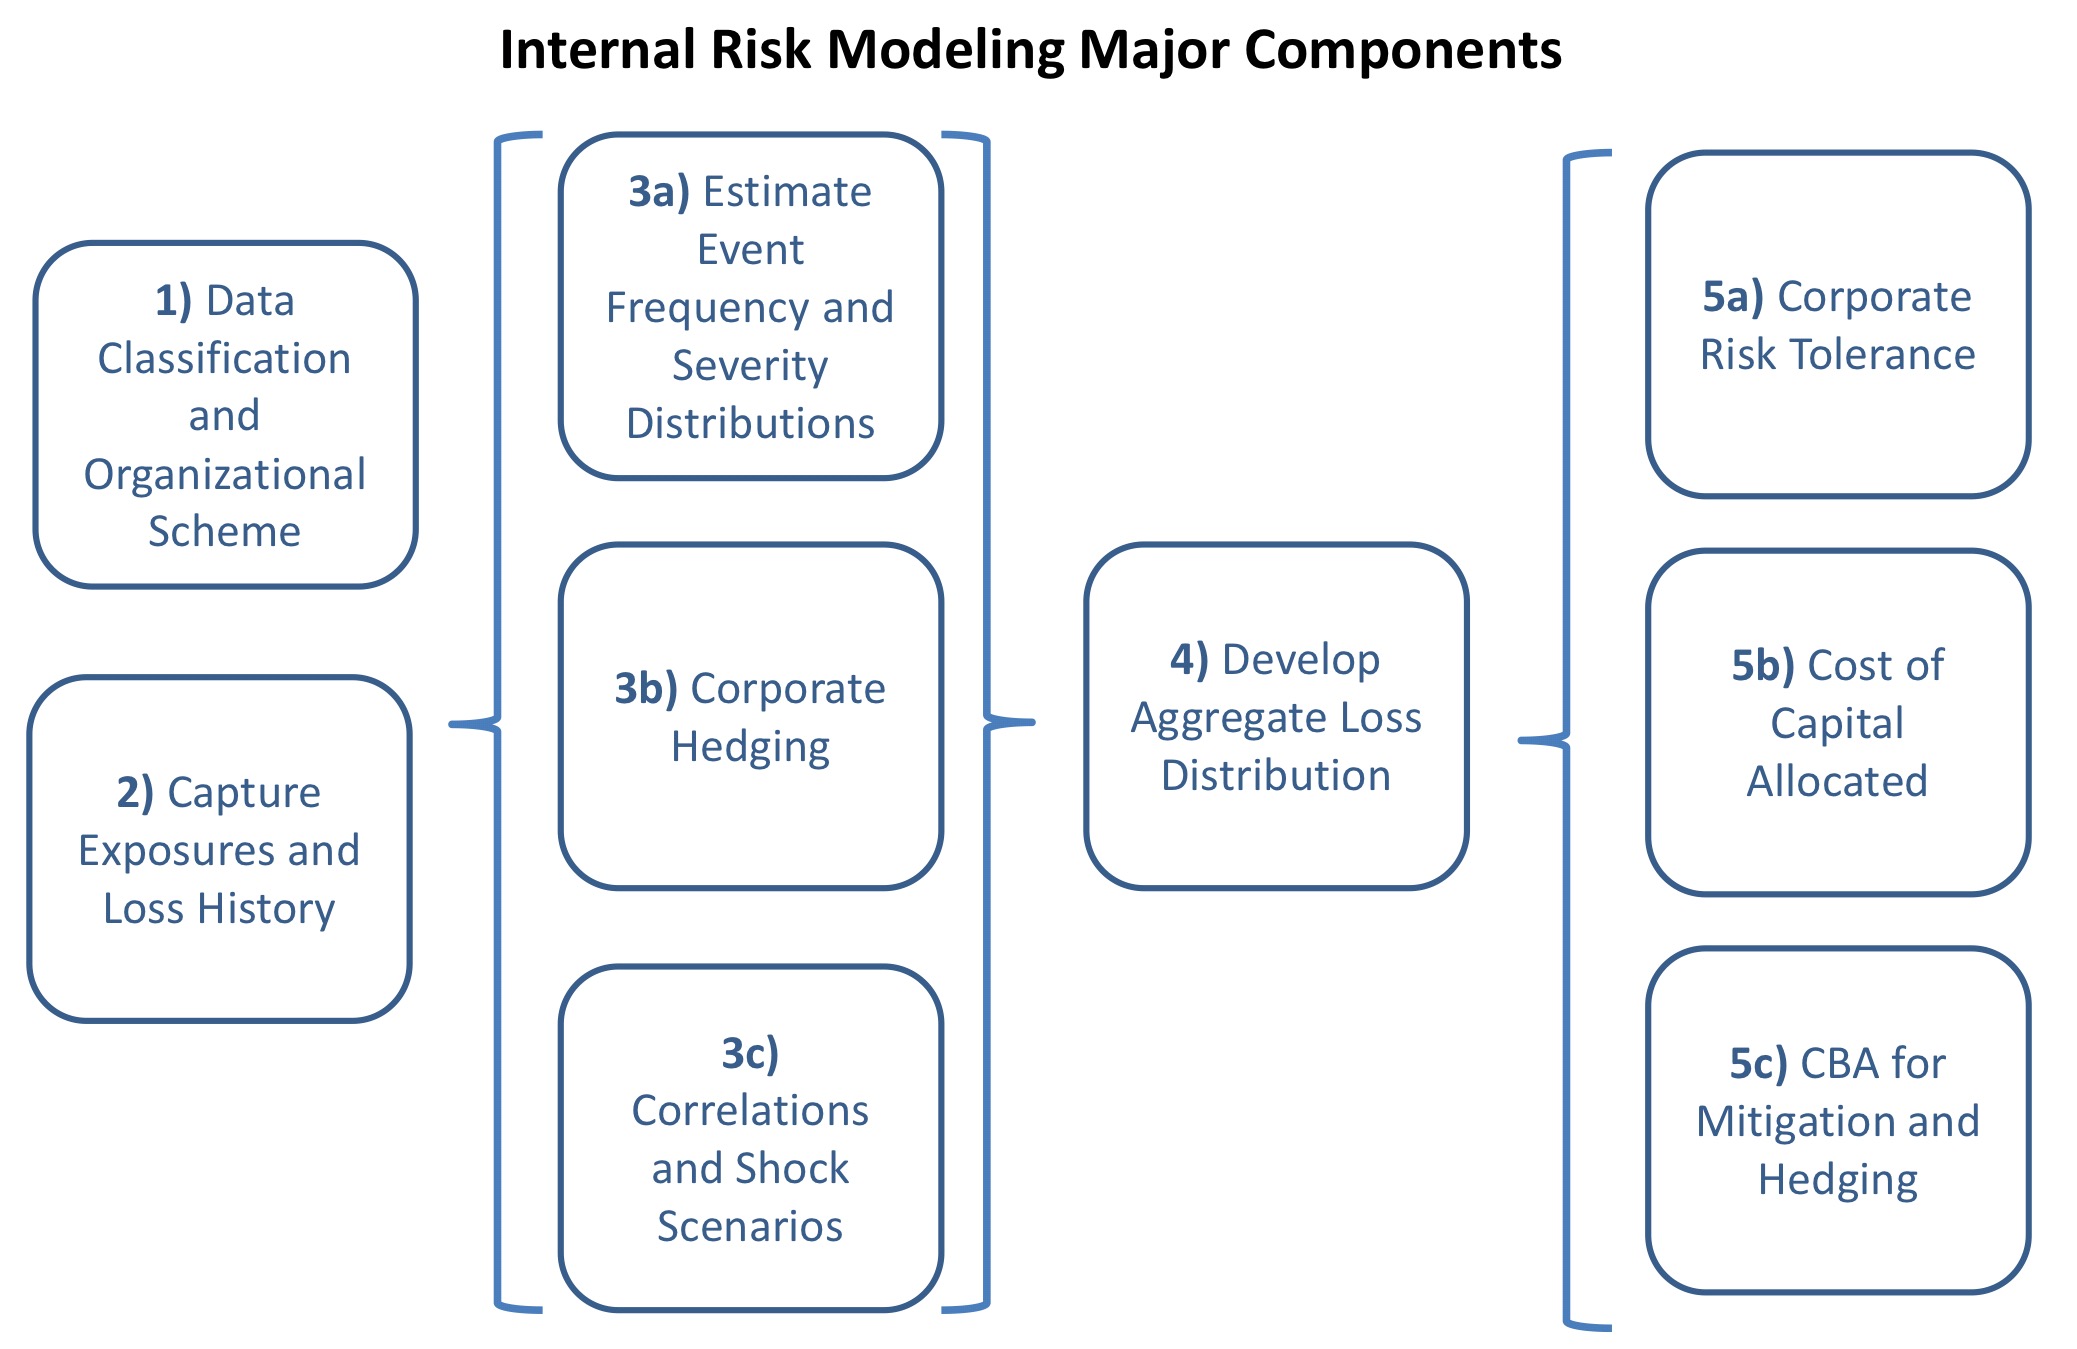
Figure 17.4: Risk Model Components
Attribute Cost Back to Source of Risk
Estimate aggregate loss distribution (4 Above)
- Distribution of outcomes for each LoB \(\Rightarrow\) Correlate outcomes \(\Rightarrow\) Correlate on external sources
Quantify the impact of the loss outcomes on the organization
Amount of P&L or level of PHS
Can be a distribution
Assign a cost to each amount of impact
- Utility function will be non linear \(\Rightarrow\) Higher cost to events further out in the tail (e.g. $20m loss is more than twice as bad as a $10m loss)
Attribute cost to source (e.g. BUs)
17.2.1 5a - Corporate Risk Tolerance
Definition 17.1 Corporate risk tolerance
How much risk a company is willing to take
What tradeoffs the company is willing to make in terms of reduction in expected profits to reduce risk
How much fluctuation in annual results it is willing to bear
- Needed in Steps 2 and 3 above
Corporate risk tolerance is a combination of the following factors:
Organization Size: Depending how much capital a firm have to deploy to invest in project each year changes how big an investment is
Capital: The % impact to the firm’s total capital is more telling than the nominal value \(\Rightarrow\) Firm with higher capital can tolerate bigger nominal value volatility
Volatility:
Investors might want steady stream of dividend paid \(\Rightarrow\) Lower risk tolerance
Public firms with quarterly earnings are rewarded for having consistent predictable profits \(\Rightarrow\) Lower risk tolerance
Private firm can afford to have more volatile results
17.2.1.1 Risk Preference Function
Risk tolerance can be defined by a risk preference function (or utility function)
- Translation of impact into cost requires a risk preference function
Properties of risk preference function
Non linear e.g. \(U(x) = A + B \cdot \operatorname{ln}[x+c]\) or \(U(x) = A - e^{ -x / R }\)
Slope decrease further into profit while increases further into losses
- A linear straight line represents risk neutral utility
Source of risk preference function
Implicitly taken from an outside source (e.g. capital market)
Explicitly derived from firm management attitudes
See section below from Spetzler
Spetzler’s process output a transparent, objective, mathematical expression of the corporation’s acceptable risk-reward tradeoff
This can improve cost-benefit analysis (CBA) by quantifying the minimum decrease in risk sufficient to justify a certain mitigation cost
Without such a function, CBA can still be made but will be inconsistent and opaque driven by the individual decision makers’ intuitions and preferences
Walls show how to select projects with the efficient frontier and utility curve
17.2.1.2 Spetzler
“The Development of Corporate Risk Policy for Capital Investment Decisions” - Spetzler 1968
Paper found that managers have very different risk tolerate and found that they are likely to be too conservative for small projects (damages not meaningful to the firm as a whole)
Useful for management to:
see the different utility curves for different managers
make decisions on where the company utility curve should be and communicate that to the day to day decision makers
Benefits of Utility Curve:
Transparent, objective mathematical expression of the firm’s acceptable risk/reward trade offs
Without, risk/reward decisions criteria will be inconsistent and opaque and driven by individuals
17.2.1.3 Walls
“Combining decision analysis and portfolio management to improve project selection in the exploration and production firm” - Walls 2004
Calculates efficient frontier \(\Rightarrow\) Estimate risk tolerance \(\Rightarrow\) Where on the frontier to select the best portfolio
Efficient Frontier
Given \(n\) projects with \(\operatorname{E}[NPV_i]\) and \(\sigma_i\), the firm can choose to participate on each project with % \(x_i\)
Given the budget based on current portfolio, an efficient frontier is built based on the lowest portfolio \(\sigma\) given different expected NPVs
- They note that the current portfolio is not optimal
The next 3 point is to decide where on the efficient frontier to be on
Risk Tolerance
Risk tolerance level \(R\) and utility function tells you where the firm choose to be on the efficient frontier
\(R\) is estimated based on where the decision maker is indifferent from a gamble of 50% of \(R\) and 50% of \(-R/2\) and not taking it (take the expected value?)
Expected value is \(\dfrac{R}{4}\)
Utility Function
\[U(x) = 1 - e^{ - x / R}\]
Tell us how much risk is the firm willing to tolerate
How much reward are we willing to give up for a given reduction in risk and vice versa
Certainty Equivalent
With the above, calculate Certainty Equivalent (CE) of a given portfolio:
- CE = The fixed amount that the firm is indifferent between taking the risky portfolio or the fixed amount
CE changes based on the \(R\) selected
Pick the portfolio with the highest CE
Negative CE means the firm would be better of not investing in it
Firm must answer these questions:
How much risk are we willing to tolerate (Picking \(R\))
How much reward are we willing to give up for a given reduction of risk and vice versa (Expressing its risk preference, utility curve)
Are the risk-reward trade offs available along the efficient frontier acceptable to us (Answer by the first 2 points)
17.2.2 5b - Cost of Capital Allocated
Definition 17.2 Risk capital is a measure of firm’s total risk bearing capacity
It is only an aggregate measure
It gives counterparty confidence that the financial firm can perform
- Still an open question in actuarial science
17.2.2.1 Allocation
Cost of risk capital is being allocated, not the capital itself
Allocation of risk capital is theoretical since no capital is actually transferred to the policy
Useful to allocate risk capital to risk-taking units
(And non risk-taking units too maybe)
Total risk capital required is reduced by diversification benefits and the contributions to risk are not linear (See ERA 2.2)
Return on Risk Adjusted Capital (RORAC)
Risk capital allocation is use as an interim step in assigning the cost of risk capital to portfolio elements
Allocate capital in a risk adjusted way \(\Rightarrow\) Riskier sources require more capital
Apply firm wide hurdle rate to determine cost of capital for each portfolio elements (e.g. BU)
\(\neq\) RAROC as RAROC adjusts the hurdle rate and does not allocate capital in a risk adjusted way
Bypassing Allocation
Mango argues that concept of allocating capital is meaningless as each risk source has access to the capital of the firm (i.e. the entire pool of risk capital is a shared asset)
Focus on cost of capital the risk source uses we get a direct answer
Bypass allocation and goes straight to the cost
How to determine the cost is the difficult part
Idea is based on Merton and Perold where they define risk capital as the amount needed to guarantee the performance of the intermediary’s contractual obligations at the default-free level
- The cost of purchasing this protection in the market is the cost of risk capital
A good candidate for decision variable is EVA if we only have cost of risk capital:
EVA
EVA = Economic Value Added = NPV - Cost of Capital
EVA > 0 means BU is adding value
17.2.3 5c - CBA for Mitigation
Cost-benefit analysis (CBA):
- We can do this once we have the corporate risk tolerance and capital cost allocation
CBA with EVA
- Mitigation effort that has positive EVA should be done
CBA with Capital Allocation
- Projects that reduce capital cost by more than the cost of the project should be undertaken