17.1 Evoluation of Corporate Decision Making Under Uncertainty
Decision making under uncertainty
3 evolutionary steps:
Deterministic Project Analysis:
Forecast cashflow, return metric (e.g. NPV) and sensitivityRisk Analysis:
Distribution of inputs (e.g. Revenue) and distribution of outcomeCertainty Equivalent:
From 2) run the outcomes through a risk preference function of the company
17.1.1 Deterministic Project Analysis
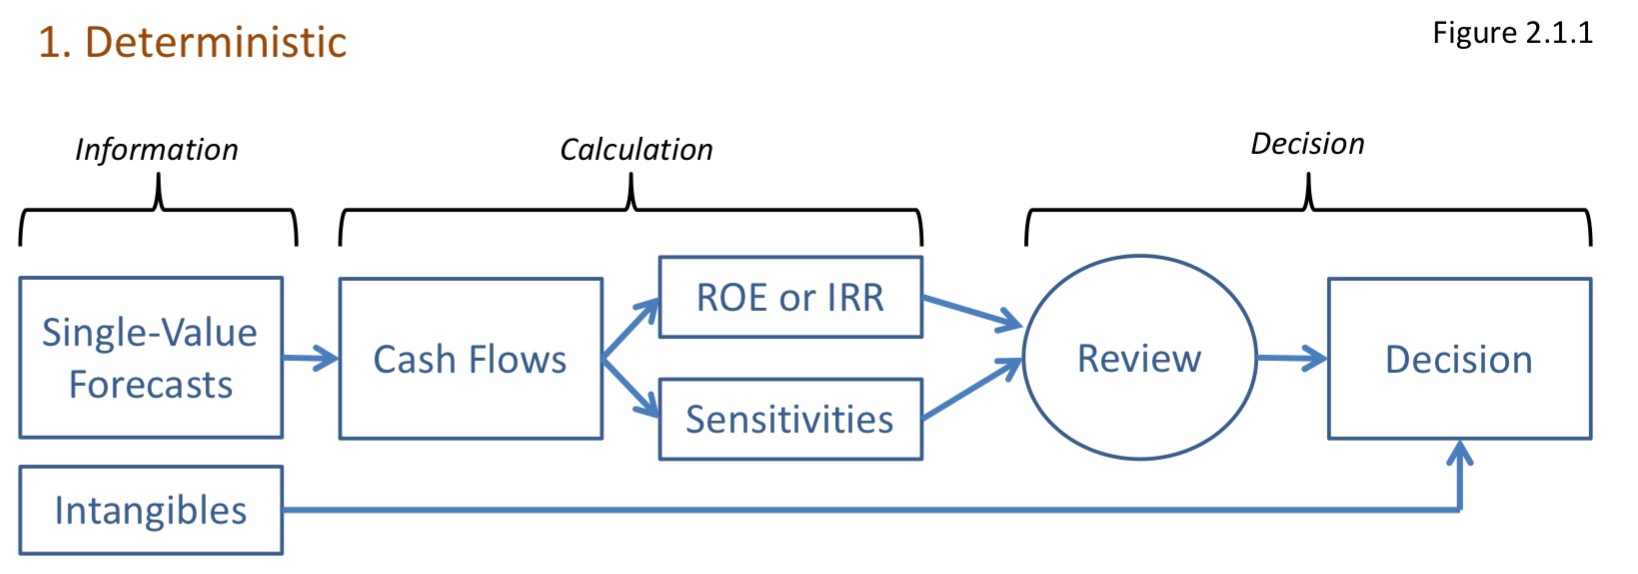
Figure 17.1: Deterministic
Remark.
Single deterministic forecast of cash flow
Return metric using NPV or IRR
Sensitivity test on inputs (e.g. revenue, expense, cost of capital)
- Sensitivity doesn’t have any probabilities assigned for each scenarios
- Uncertainty is handled judgmentally
17.1.2 Risk Analysis
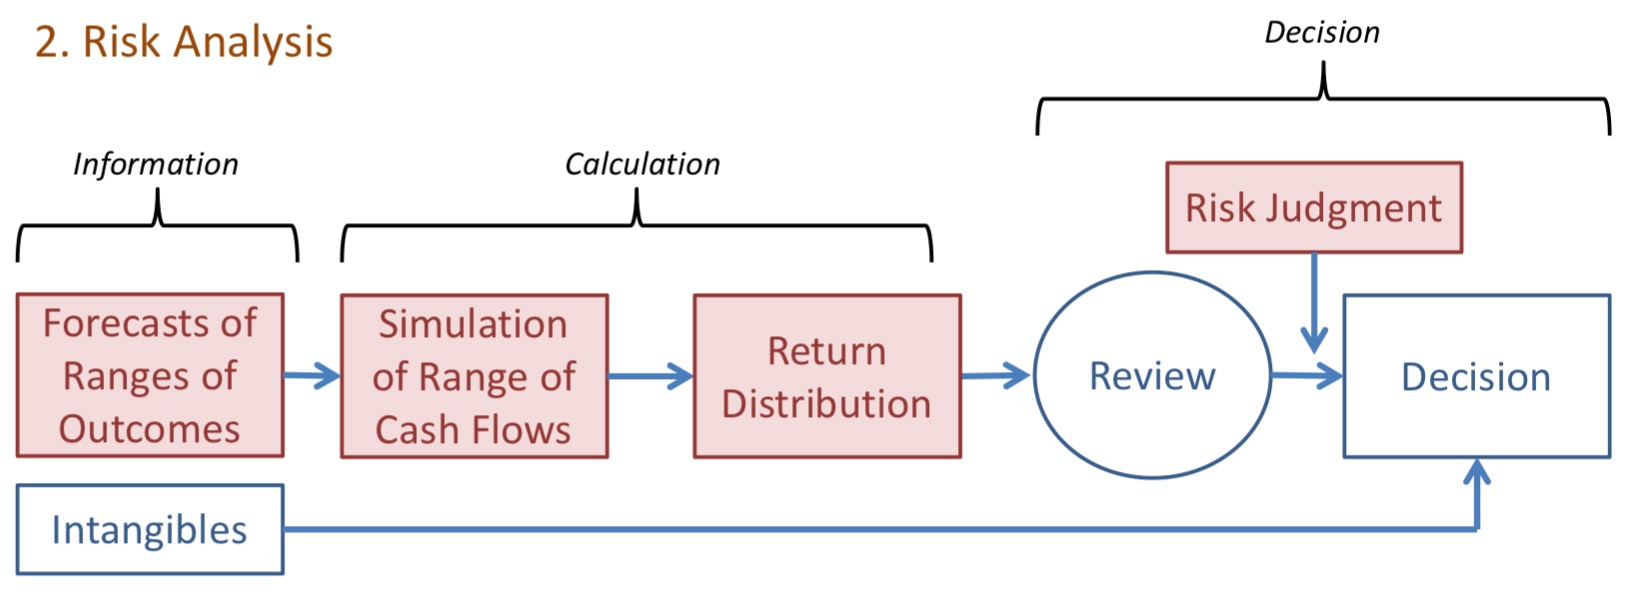
Figure 17.2: Risk Analysis
Remark.
Critical inputs have a distribution (w/ correlations)
\(\hookrightarrow\) Output is a distribution of NPV or IRRUncertainty is handled judgmentally
(Good portion has been moved into the distn)
17.1.2.1 Reason to Stay in Step 2
Argument that step 2 is sufficient (Current best practice 2007):
Since investors are only compensated for systemic risk and not firm specific risk, no need to focus on firm specific risk
Based on portfolio theory where investors holds many different firm so the firm specific risk are diversified away
\(\therefore\) Only need to manage systemic risk
Counter argument:
Management can’t distinguish between systemic and firm risk
Risk-adjusted discount rate reflect risk only if there is a time lag
For many kinds of risk the time aspect is unimportant
(Risk is instantaneous - jump risk)
Jump risk is still present as information have a time lag
Market based information lack the refinement and discriminatory power (too noisy) for management to be able to do proper cost-benefit analysis and make trade off decisions
17.1.3 Certainty Equivalent
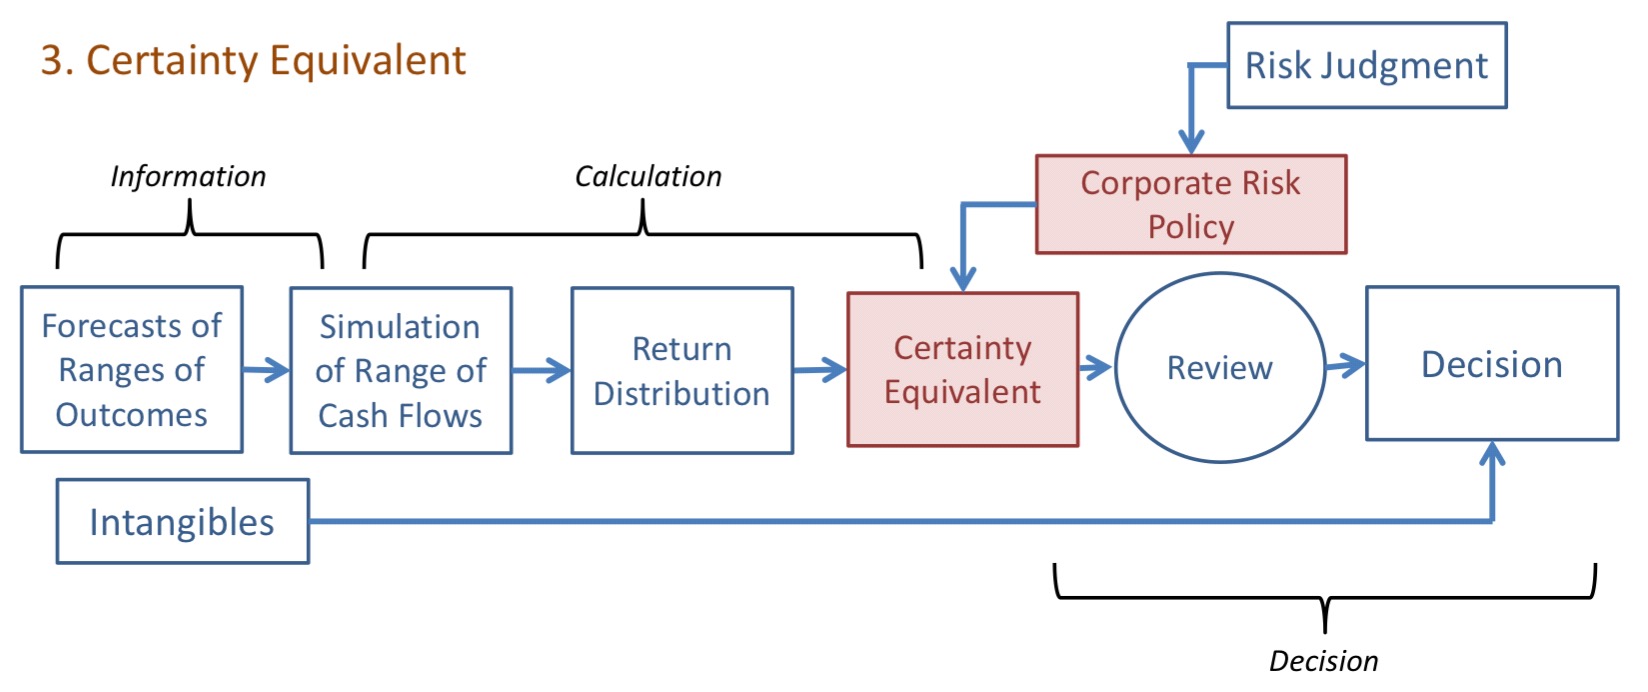
Figure 17.3: Certainty Equivalent
Remark.
Distribution output from risk analysis is input to a utility function for the firm
Utility function is based on corporate risk policy
Purpose is to express preference in a transparent and consistent manner
Benefits of utility function
Objective: Once parameterized, does not require subjective opinion
Consistent: Can be applied to different risk
Repeatable: Can apply again to get the same results
Transparent: Easy to document
17.1.3.1 Reason to Move to Step 3
Risk managers and shareholders are both interested in preserving franchise value
\(\hookrightarrow\) Want risk management in place to protect franchise value
\(\hookrightarrow\) Both should support policies to help make risk management more objective, consistent, repeatable, and transaparent
\(\therefore\) Provides some degree of support for evolution to step 3
Market Value = Book Value + Franchise Value
Franchise Value = Value of future earnings growth