26.4 Supply and Demand
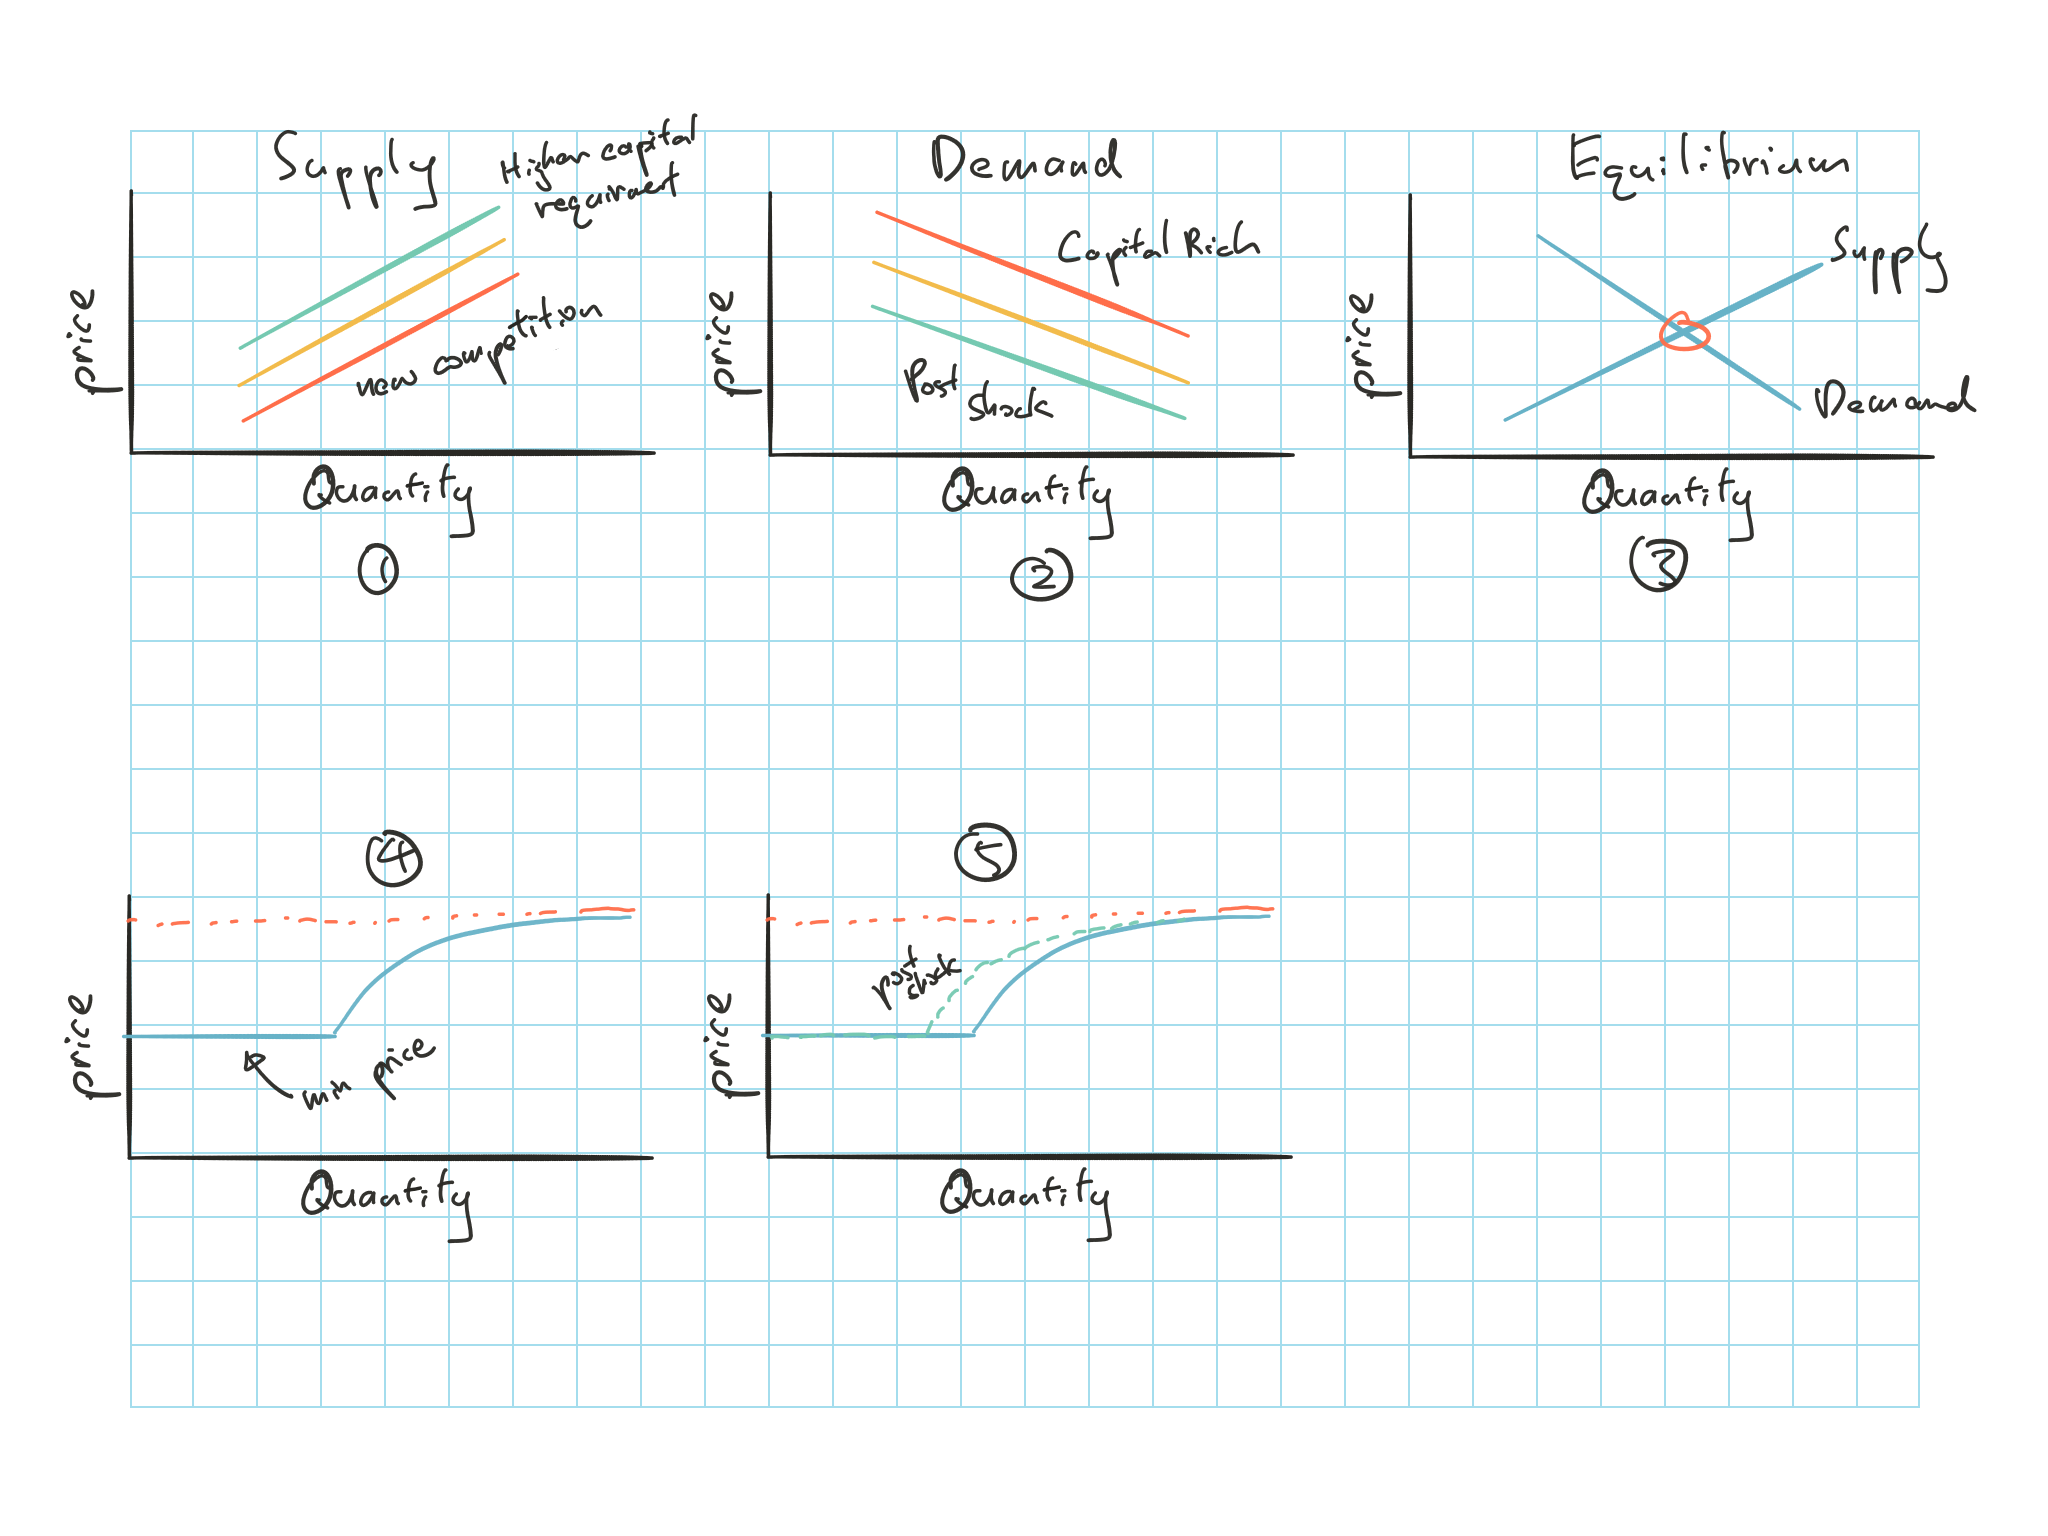
Figure 26.1: Supply and Demand on quantity vs price
Supply
New competition or technology increases the quantity available at a given price
\(\hookrightarrow\) Shifting curve \(\searrow\)
- More quantity for same price
Higher capital requirement
\(\hookrightarrow\) Shifting curve \(\uparrow\)
- Less quantity for same price
Demand
Excess capital makes insurance more valuable
\(\hookrightarrow\) Shifting curve \(\nearrow\)
Shock to capital
\(\hookrightarrow\) Shifting curve \(\swarrow\)
Remark.
Curve above is for industry
If the industry is well capitalized, its promise to pay claims are worth more and the insurance produce is more valuable and more demand for it
If there’s a shock event that reduce the industry’s capital, it will reduce demand for the product
- Company demand curve will be flatter since customers can go to another company for small changes in price
\(Quantity = f(Price)\)
Alternative way to think about this
When companies are capital rich, customers want more product for the same price
When new competition comes into the market, the same price will have more produce available
Market price = where supply meets demand
- Difficult to empirically estimate the curves because only the equilibrium is observable
26.4.1 Gron Supply Curve
Plot 4 above in fig. 26.1
The first flat section:
- There is a minimum price for insurance product
\[\text{Minimum Price} = \text{Expected Losses} + \text{Marginal Expenses}\]
- Supply is perfectly elastic for a certain quantity, where the supply will increase without an increasing price
The curved section:
At certain point firm will require additional capital to support the business, and the price must increase
Once price hits a a certain level, profits are enough to cover the additional capital and the supply curve approaches a price asymptotically
This is high AE from Goldfard’s perspective
Plot 5 above in fig. 26.1
Shock scenario:
Curve would simply shift \(\leftarrow\)
Expected loss + marginal expense is still the same
Amount of capital the company have before it needs to seek additional capital has changed