24.7 Tail Concentration Functions
Measure how much probability is concentrated in the tails
24.7.1 Left Tail Concentration Function
What is the probability that \(U\) is small given that \(V\) is small
\[L(z) = P(U < z \mid V < z) = P(V < z \mid U < z)\]
- Works both ways can do \(L(z) = P(V < z \mid U < z)\) as well
Left tail concentration function
\[\begin{equation} L(z) = \dfrac{C(z,z)}{z} \tag{24.26} \end{equation}\]LTC function for Independent copula:
\[\begin{equation} L(z) = z \tag{24.27} \end{equation}\]Graph this to 0.5 because all copulas have \(L(1) = 1\)
See Graph (1) in fig. 24.1
24.7.2 Right Tail Concentration Function
What is the probability that one variable is large given that the other variable is large
\[R(z) = P(U > z \mid V > z) = P(V > z \mid U > z)\]
Right tail concentration function
\[\begin{equation} R(z) = \dfrac{1 - 2z + C(z,z)}{1-z} \tag{24.28} \end{equation}\]RTC function for Independent copula:
\[\begin{equation} R(z) = 1 - z \tag{24.29} \end{equation}\]Graph this from 0.5 to 1.0 because all copulas has \(R(0) = 0\)
See Graph (2) in fig. 24.1
24.7.3 LR Graph
Combine the 2 above we have the tail concentration graph or the LR graph
- See Graph (3) in fig. 24.1
The independent copula = product copula
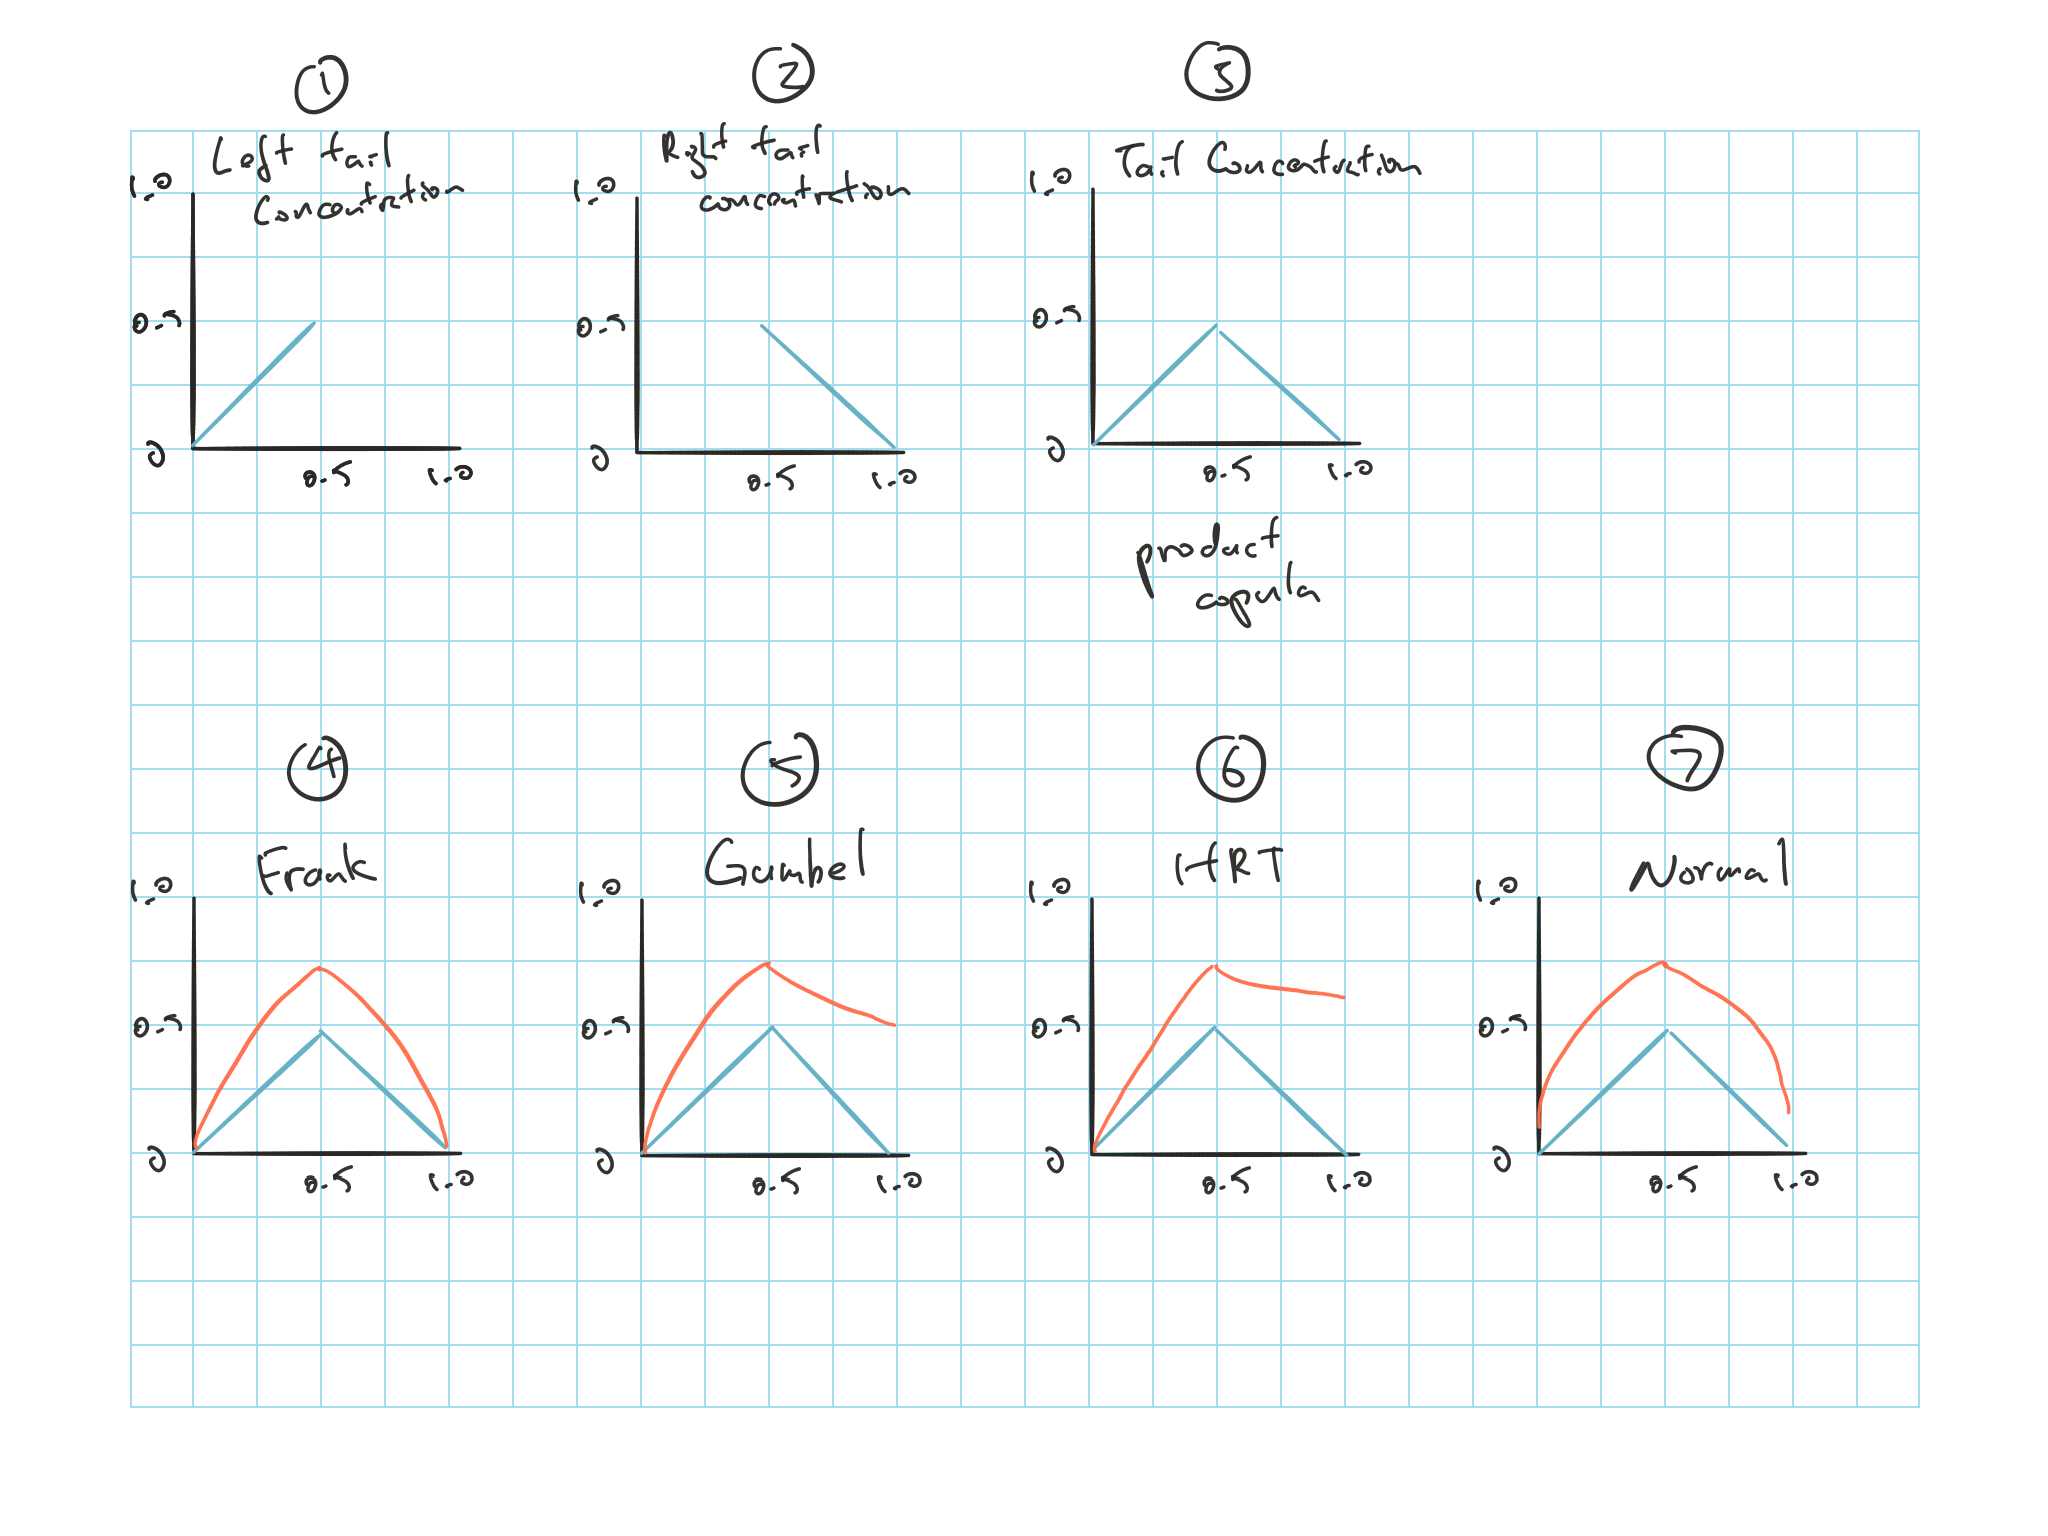
Figure 24.1: Tail concentration graph
Graph (4) it approaches 0 on the left and right
Graph (5) asymmetric, right limit is not 0 (converges about 0.5)
Graph (6) asymmetric, right limit is not 0, and higher than Gumbel. Has the thinnest left tail
Graph (7) it approaches 0 on the left and right but slower, simply because we couldn’t calculate the tail so deep
As the \(\tau\) gets higher, we can start the see the difference between them
| Copula | \(R\) | \(\tau\) |
|---|---|---|
| Gumbel | \(2 - 2^{1/a}\) | \(1 - \dfrac{1}{a}\) |
| HRT | \(2^{-a}\) | \(\dfrac{1}{2a + 1}\) |
| Normal | 0 | \(\dfrac{2 \arcsin(a)}{\pi}\) |
| Frank | 0 | Complicated… |
| PP Power | \(\dfrac{1}{1 + a}\) |
- Table is not on syllabus but just for information